
Profitability
Gross Margin

Although gross profit (GP) nearly doubled in the last 5 years [CAGR (2007-2011) = 19%], gross margin (GM) fell 7% in that period (or 2 p.p.). There’s no clear trend on GM and despite the decline in the period, the company did better in 2011.
So 2009 and 2010 were the years of GM decline. Why? The company reports (i) selling more servers and networks solutions which have historically lower margins, (ii) price pressures from customers facing worst economic conditions, (iii) searching new opportunities near new customers, (iv) decrease in first call support services which generally have a higher margin and (v) some additional accounting costs related to Incentra’s acquisition to lower some contract costs.
2011’s better performance seems to be due to a more mature strategy of selling total solutions into the data center.

To understand the evolution of margins of product and services sales I need to understand which are the main products and services and their margins. That way I can try to forecast (based on Industry research) how the profitability of the company will be in the future.
As usual, services have a generally higher margin than products, but support services have a higher margin than installation and configuration. Note that in 2010, product sales increased 90% and that installation and configuration services are related to product sales. Actually, in 2010 I&C services accounted for 11% of total services sales compared to 6% in the previous year. This also helps to explain the margin drop in 2010.
In product sales the same occurs. Storage products have a higher margin than Networks and Servers. All of this to say that the floating margin has to do a lot with the mix of projects in pipeline.
Operational Margin
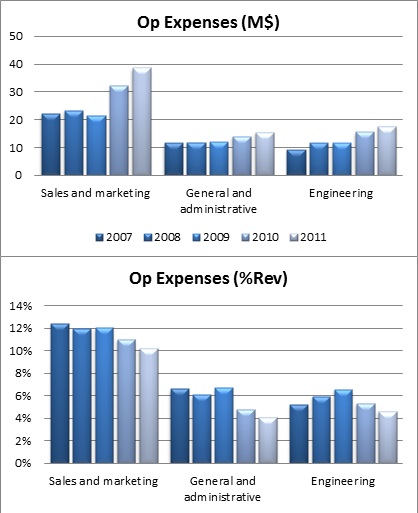
Datalink’s main operating expenses are increasing as it should in a growing business, but are decreasing as a percentage of revenues showing some gains in operational efficiency. Note that S&A and Engineering are linked to products and services sales, respectively.
Sales and Marketing: Includes wages and commissions of Marketing staff, travel, advertising, promotion and hiring expenses. Fluctuations in former years were mainly due to variable compensation linked to revenue performance. Of course acquisitions have a great impact on this.
General and Administrative: includes wages for administrative personnel, professional fees, depreciation, communication expenses and rent and related facility expenses. Its fluctuations have been driven by acquisition processes that result in more rents and more personnel.
Engineering: includes employee wages and travel, hiring and training expenses for field and customer support engineers and technicians. DTLK allocates engineering costs associated with installation and configuration services and with consulting services to cost of service sales, so the expenses accounted here are the unallocated expenses. Changes along the years are due to Incentra’s and Midwave acquisitions which have increased engineering headcount by 31% and 82%, respectively.
Amortization of Intangibles: although these costs are immaterial I want to explain that they are related to the acquisitions and the intangible assets involved like order backlog, customers relationships, non-competing agreements. Well these assets have a time period through which they are diluted. In 2012 Datalink estimates these costs to be $2.5M.


Overall, cost of sales has been around 73% and 76% of revenue with a slightly upwards trend, especially in 2010. Operational expenses have been increasing at a slower pace than sales do which is the main reason why operational margins have been increasing.